Finding an Earth-like Exoplanet
So if we will be getting all this data from the Kepler mission, how will we know if we do find an Earth-like planet in the habitable zone? Let’s imagine we are the planet finders and have a look at some data.
VISUAL 21 (still): Light Curve Kepler-10b
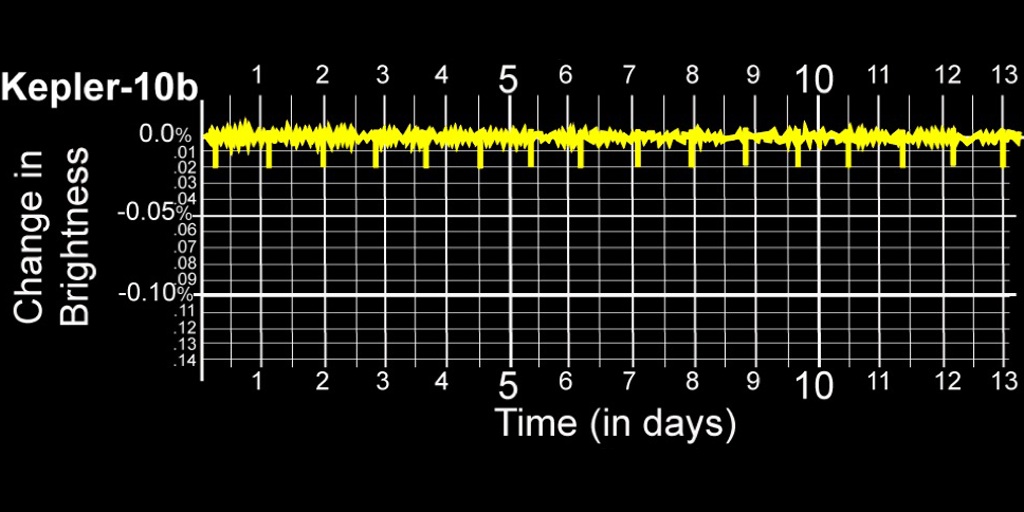
Here is light curve data from one of the Kepler stars that has a discovered planet named Kepler-10b. We can determine how big the planet is from how deep the dips in brightness are. Brightness drop here is measured in percent dimmed, 0% being no dimming and 100% being completely dimmed.
On the Kepler 10b graph, how deep is the dip, in % brightness drop?
[Almost .02%.]
VISUAL 22a (still): Planet Size Lookup Chart
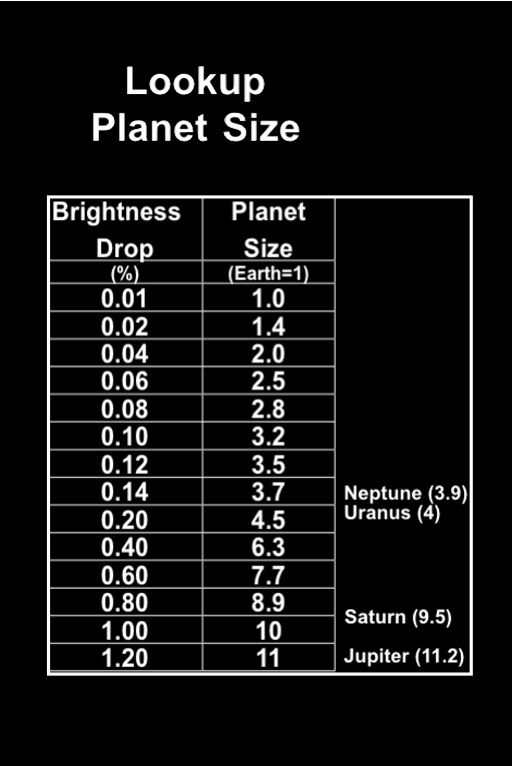
Look at the Brightness Change vs. Planet Size Lookup Chart. Notice in the first row that and Earth-size planet makes a 1/100% brightness drop for a sun-size star.
How big is a planet that causes a 0.02% brightness change in a sun-like star?
[About 1.4 times Earth size]
You can also determine how far the planet is from its star by measuring how widely-spaced the brightness drops are, to find the planet’s orbit time (period).
On the Kepler 10b graph, what is the orbit time?
[About 0.8 days.]
VISUAL 22b (still): Orbit Distance Lookup Chart
Now look on the Orbit Time vs Orbit Distance Lookup Chart. In this table, the Earth-Sun distance is often called an “Astronomical Unit” or AU. Notice that an orbit period of 365 days (or 1 year) corresponds to an Earth-Sun distance of 1 astronomical unit.
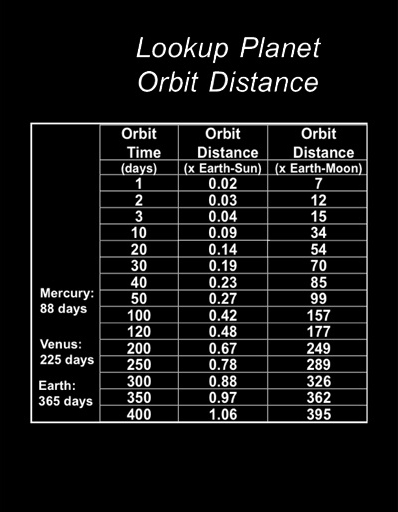
How far out is a planet with a 0.8 day period?
[Less than 0.02 AU or about 6 times the Earth-Moon distance.]
Is that an Earth size planet? [Close.]
Is it in the habitable zone? [No.]
Let’s look at Light Curve for the star Kepler-11.
[Fade off Kepler-10.]
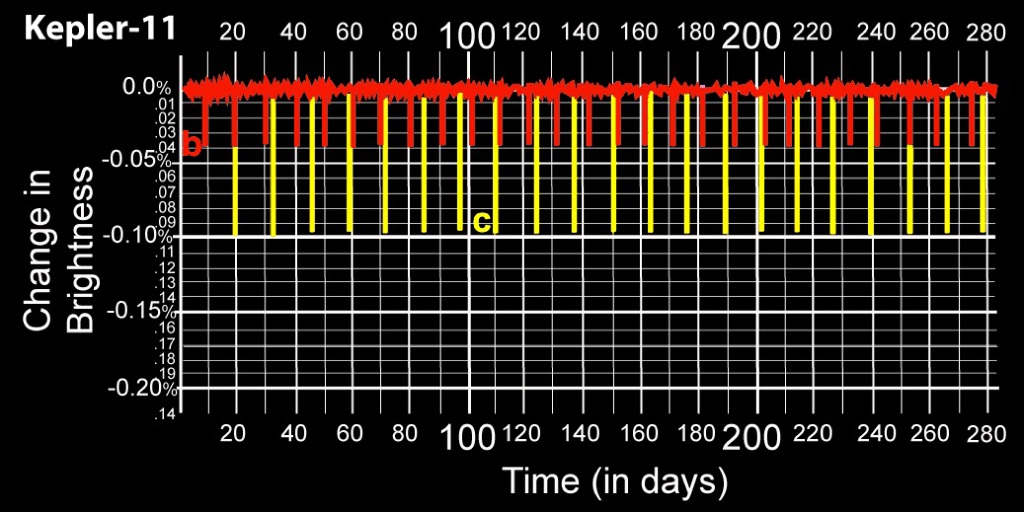
VISUALS 23a (stills): Light Curves for Kepler 11b and 11c.
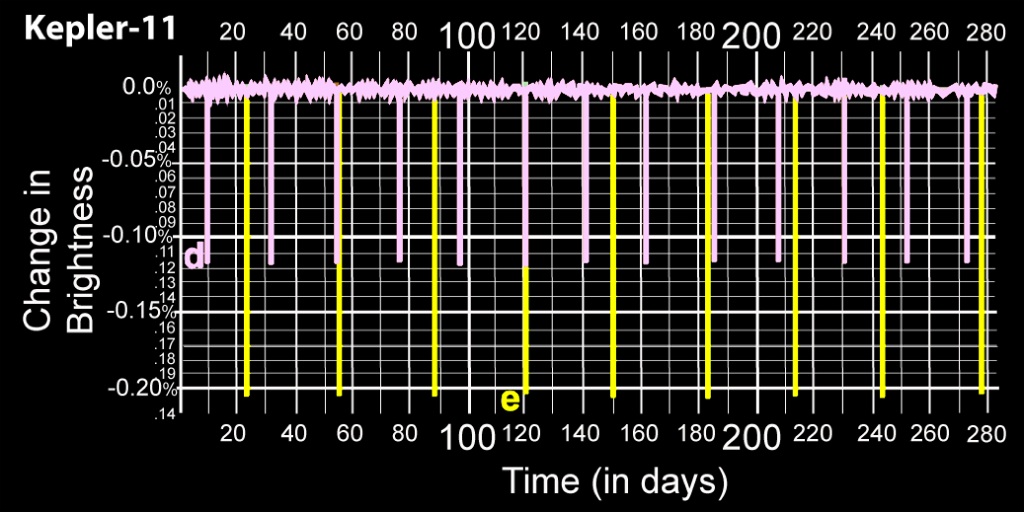
VISUALS 23b (stills): Light Curves for Kepler 11d and 11e.
VISUALS 23c (stills): Light Curves for Kepler 11f and 11g shown in graph

[Fade on the light curve for the Kepler-11.]
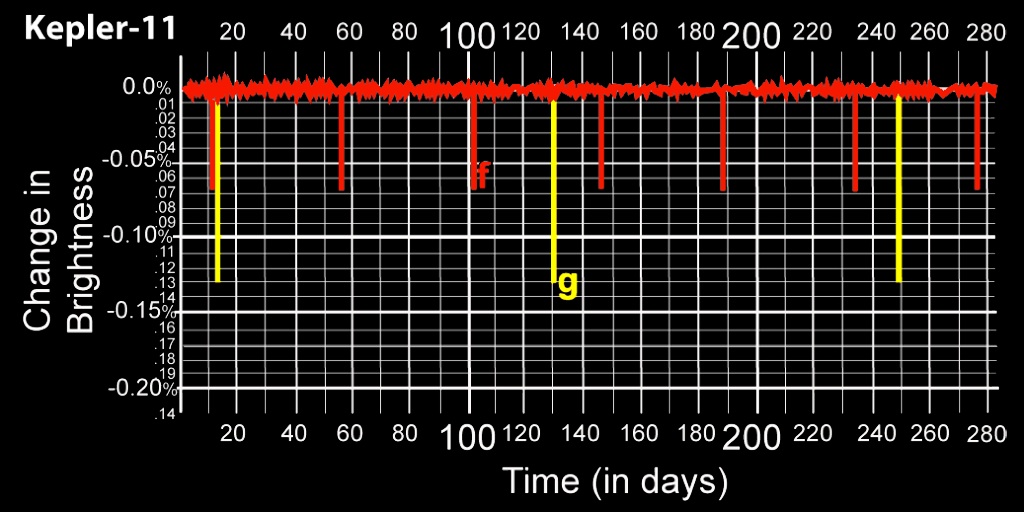
Kepler-11 has six planets both to make things easier to see, we have separate the six planets onto three separate light curves, with two of the Kepler-11 planets on each—e.g., Kepler-11b and Kepler-11c on one graph, Kepler-11d and Kepler-11e on a separate graph.
Here you should be able to see 2 planets in each of the light curve graphs.
Let’s pick one planet to focus on, say Kepler-11c.
How deep is the dip, in % brightness drop for Kepler-11c?
[0.1 or one tenth of 1%]
From the Planet Size Lookup Chart, how big is a planet with 0.1% brightness change?
[About 3.2 times Earth’s size]
What is the Orbit Time for Kepler-11c?
[About 13 days.]
Now look on the Orbit Distance Lookup Chart.
How far out is a planet with a 13 day period?
[About 0.06 AU or about 1/16 the distance from Earth to the Sun.]
Is that an Earth size planet? Is it in the habitable zone?
[No. It’s closer to the size of Uranus and way too close to the Sun.]
Optional: Pick one or more other planets of Kepler-11 and do similar analyses to determine planet size and size of orbit.
Fade off planet size/ orbit distance tables.

Fade off Kepler-11 light curves.
Optional Technique (takes longer):
After analyzing light curve for Kepler-10b as a whole group, have “small groups” analyze the rest of the light curves, Kepler-11b through g. Give out the Strange Planets take-home handout Side 1 and Side 2 to each group to find Size and Distance for each of the exoplanets from the light curves. Remind them they are looking for an Earth-size planet that is in the habitable zone of its star. If a group finishes its assigned star, they can go ahead and pick another star to work on.
Turn on “planet-finding music.”

After all have found results on their assigned star, have a discussion with the group as a whole about whether any of the planet(s) are Earth-like and habitable, and how they know that.
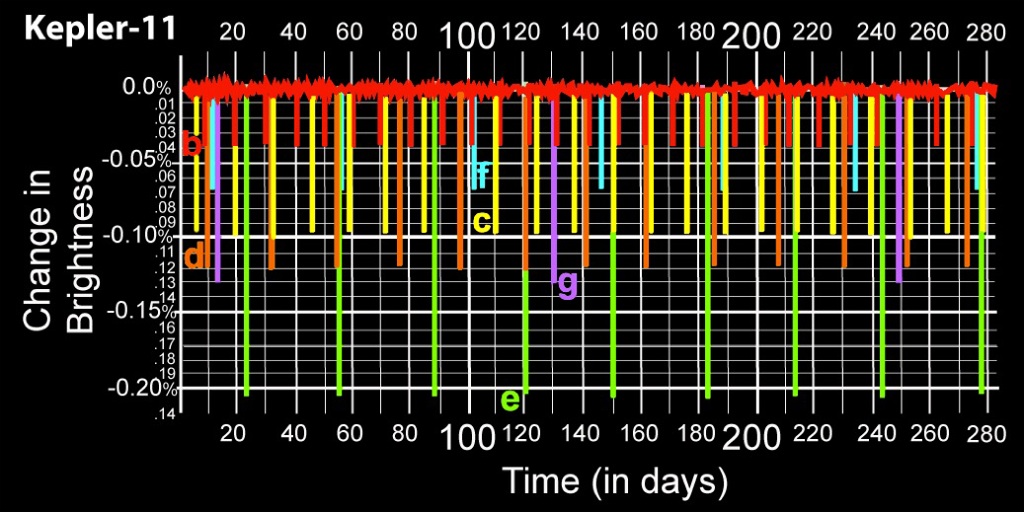
Optional: Show combined light curve for Kepler-11b, c, d, e, f, g in color coded version and/or simple black and white with no labels. This shows an inkling of complexity of what the Kepler light curve analysts are dealing with.
VISUAL 24 (optional still): Combined Light Curves for Kepler 11 (continued)

[Fade on the light curve for Kepler-11.]

All six planets are shown on one light curve.
VISUAL 25 (optional still): Combined Light Curve for Kepler 11 No Color

[Fade on the light curve for Kepler-11, with no color.]

All six planets are shown on one light curve.

[Fade off Kepler-11.]

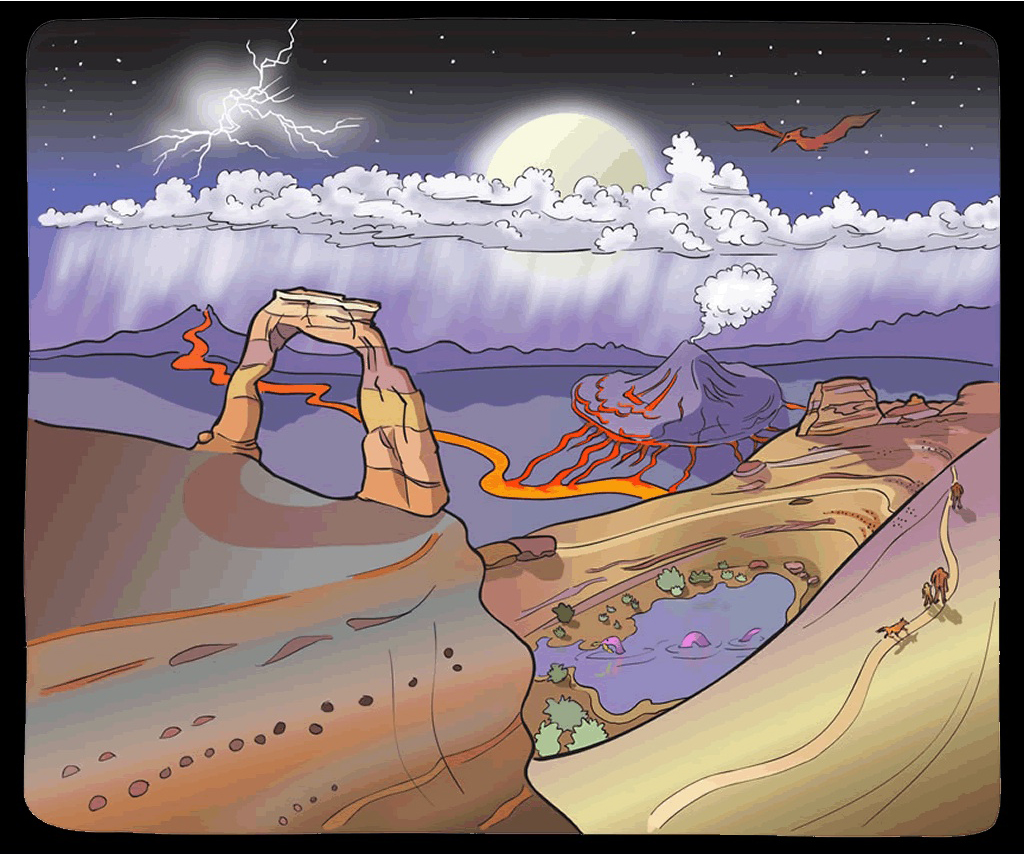
VISUALS 26a (optional still): Artist’s conception of Earth-size planet.

What does it look like—this potentially habitable planet we found?

VISUALS 26b (optional still): Artist’s conception of Earth-size planet’s surface.

What is its surface like? Does it actually have life? If it does, what is that life like?
Isn’t it amazing that just by studying a light curve graph of a star’s brightness over time, we can learn such a tremendous amount? We can find out a planet’s size, how long its year is, how far it is from its star, and even the prospects for it supporting life!
Note: It is possible to create and to load files to simulate the Kepler exoplanetary systems. These digital effects can be placeholders to add your own effects.